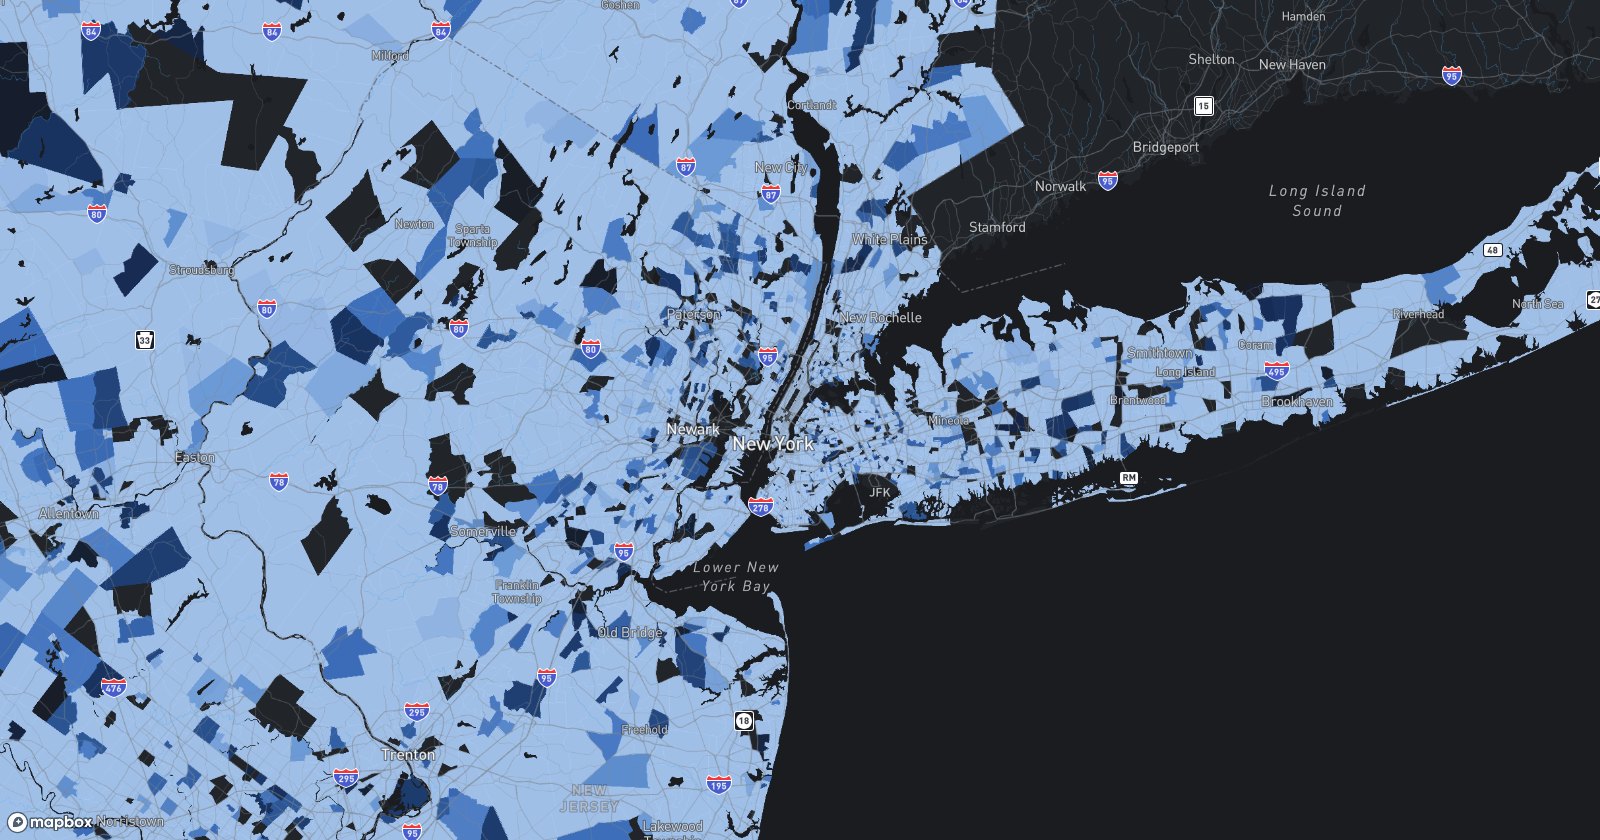
When campaigns think about political fundraising strategy, the conversation usually starts with districts and states. Buy the entire congressional district. Focus on competitive states. Increase frequency in key metros and assume the right donors will eventually see the message enough times to respond.
That logic feels sound, but it oversimplifies how political giving actually behaves.
High-dollar political donations are not evenly distributed across a state or even across a district. They concentrate. And when you examine the data at the census tract level instead of the state level, the picture changes quickly.
Political Giving Is Highly Concentrated
When we built Calder’s Political Map and analyzed nearly 80,000 U.S. census tracts, the concentration was more extreme than most media plans account for.
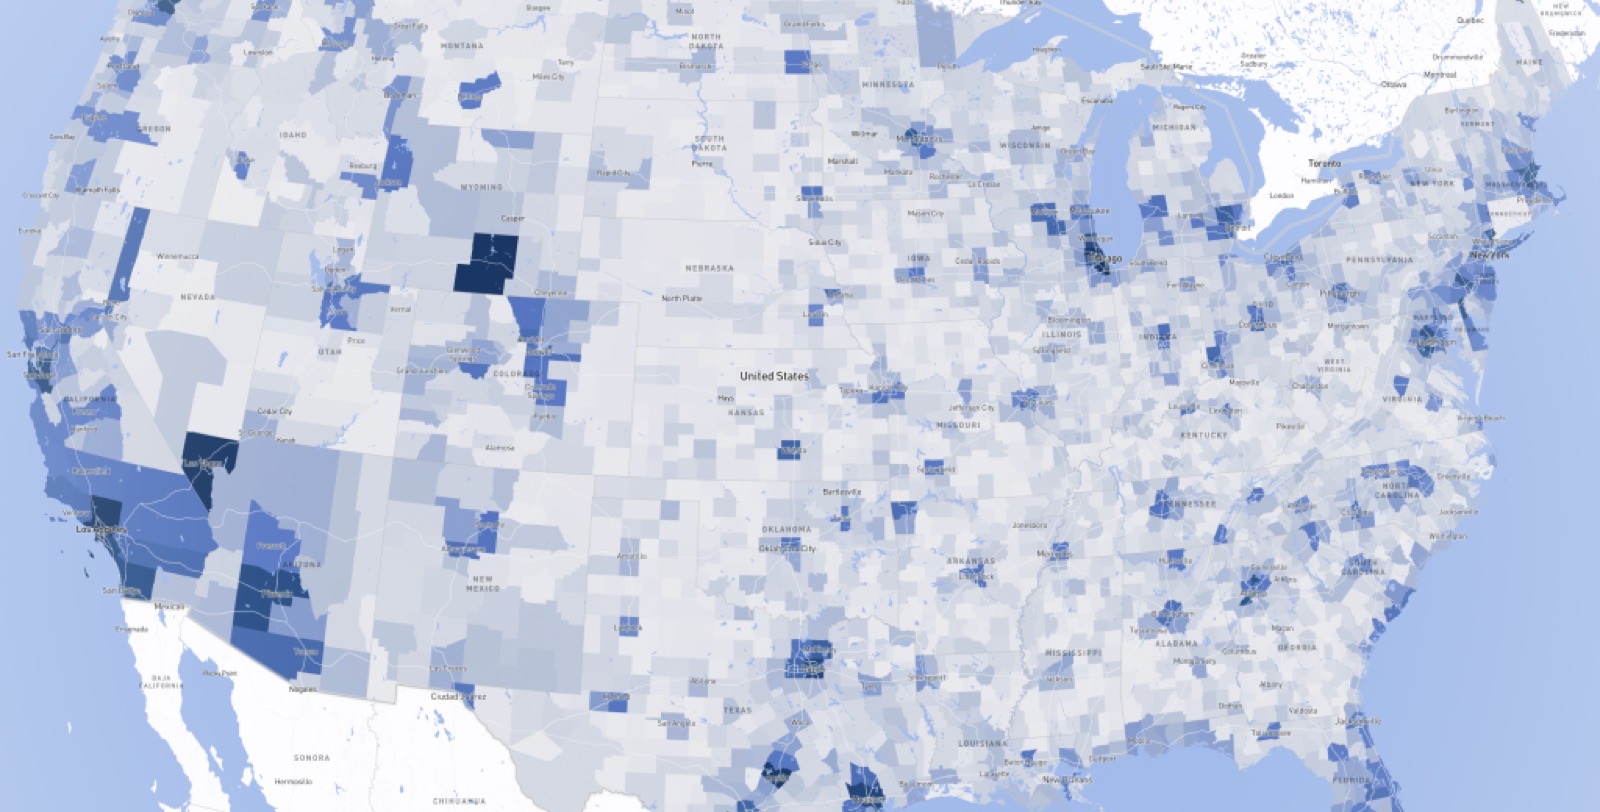
The top 1% of tracts account for 46.7% of total modeled political donation volume.
The top 5% account for more than 68%.
By the time you reach the top 10%, you are capturing nearly 78% of total donation activity.
That is not broad distribution. That is geographic compression.
Instead of being evenly spread across a district, contribution activity clusters into small, dense corridors that repeatedly show up in different markets across the country.
What the Map Actually Shows
When you zoom into specific metros inside the Political Map, the pattern becomes visible immediately.
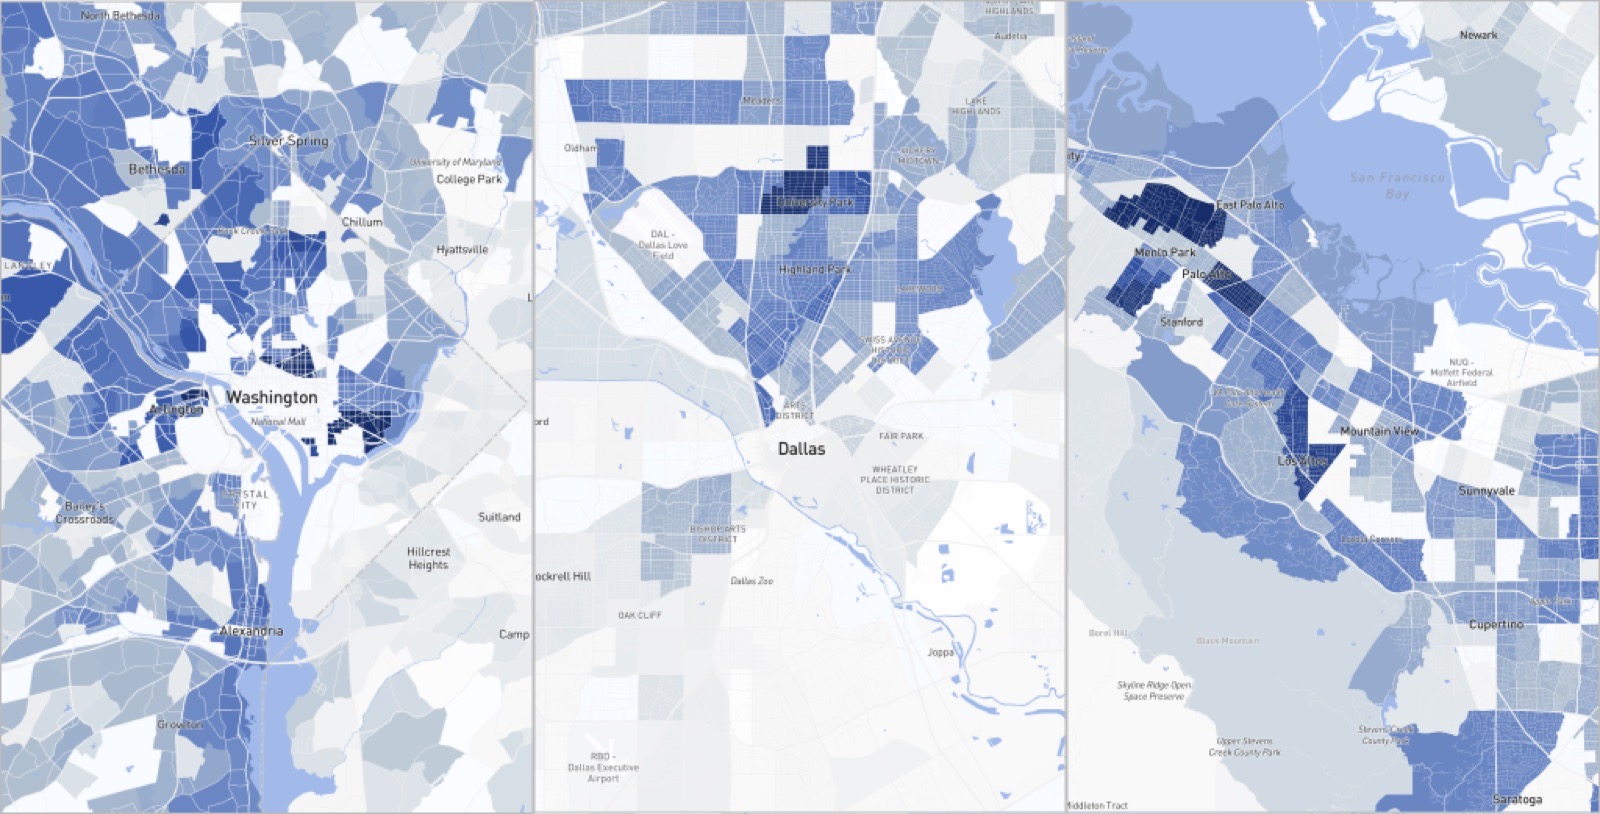
In Washington, D.C., a small cluster of central tracts accounts for an outsized share of total modeled contribution volume. In Arlington, Virginia, adjacent neighborhoods near federal and lobbying corridors show unusually high donor density relative to surrounding areas. In Dallas County, specific wealth pockets dominate fundraising activity compared to nearby suburban tracts. Even in smaller markets such as Teton County, Wyoming, ultra-high-net-worth micro-markets generate disproportionate contribution density.
These are not entire cities. They are specific neighborhoods.
You can explore the full interactive view at map.calder.so/political, where tract-level density, district overlays, and wealth correlations are visible in real time.
Once you move beyond district averages and examine the map at a granular level, it becomes clear that political fundraising operates much more like wealth accumulation than like broad demographic behavior.
Why This Changes Programmatic Strategy
Most political media buying still operates at broad geographic levels: state, DMA, congressional district. While that may be necessary for persuasion campaigns, it introduces inefficiency for fundraising efforts focused on higher-value donors.
If nearly 70% of modeled donation volume is concentrated inside just 5% of neighborhoods, spreading budget evenly across an entire district means a large percentage of impressions will land in areas that historically produce minimal high-dollar giving.
Programmatic media allows campaigns to do something different.
Instead of buying an entire district, campaigns can concentrate spend inside high-donor-density census tracts. Instead of treating all ZIP codes equally, they can prioritize corridors where wealth and contribution behavior overlap. Instead of relying on identity-based political targeting, which is heavily restricted, they can lean into aggregated geographic concentration.
That shift from broad exposure to location precision changes the efficiency equation.
How Calder Activates Political Density
Calder’s Political Donor segment is built by layering public contribution data with tract-level donation modeling, income distribution, property ownership signals, and broader wealth indicators from Calder’s Wealth Graph.
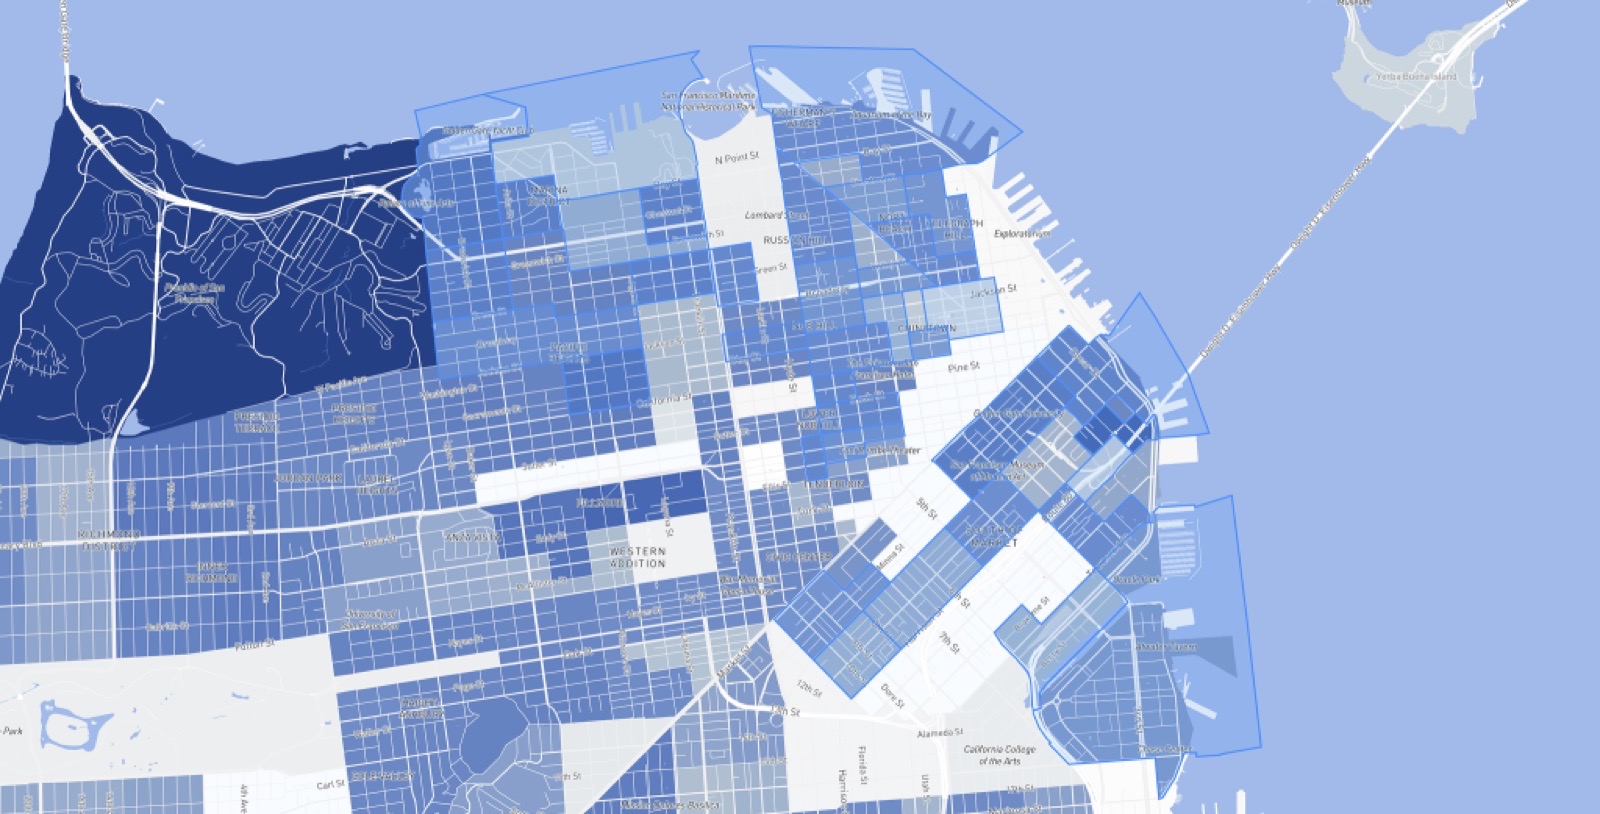
The output is not a list of individuals. It is a geographically structured audience designed to align political contribution behavior with wealth concentration.
Because the concentration is so extreme, geographic targeting becomes a meaningful proxy inside regulated environments. Campaigns can activate high-density tracts directly within major DSPs, layer them with income thresholds, and deploy through standard PMP or Deal ID structures without requiring custom integrations.
In practice, that means budget can be concentrated where contribution behavior already exists rather than diluted across areas with limited fundraising history.
The Broader Implication
Political fundraising simply makes something visible that applies across high-value categories more broadly: capital clusters.
Wealth clusters. Assets cluster. Donation behavior clusters.
Media strategy should reflect that reality.
When nearly half of modeled political donation volume comes from just 1% of neighborhoods, precision is no longer a marginal optimization. It becomes structural.
And when regulation limits personal political targeting, geography becomes the most reliable signal available.
Calder’s Political Map and segment were built around that principle.